|
Nominal Ledger User Defined
Reporting |
Screen Shots |
|
Nominal Ledger User Defined Reporting is
performed within Nominal Ledger Posting Account Maintenance under the ‘NL
Report Definition’ page. Within the Nominal Ledger (NL) you are able to define an unlimited number of ‘Report Structures’ and ‘Report Column Sets’ which are used to output reports as PDF or formatted MS Excel spreadsheets. Report Structures allow you to define a layout of NL, SORP or Management Accounts within a structured series of headers and sub-headers. Column Sets allow you to define up to 8 columns of data for output to PDF/Excel, or up to 15 columns of data for output to Excel. These columns can be Actual Balances, or Initial/Revised or Operating Budget figures or variances between these for periods defined relative to run time criteria. Producing a report goes through 4 or 5 of these stages: 2. Defining the Report Structure 4. Adjusting Report Values (optional and audited)
|
Figure 1: NL Report Definition in NL Posting Account Maintenance |
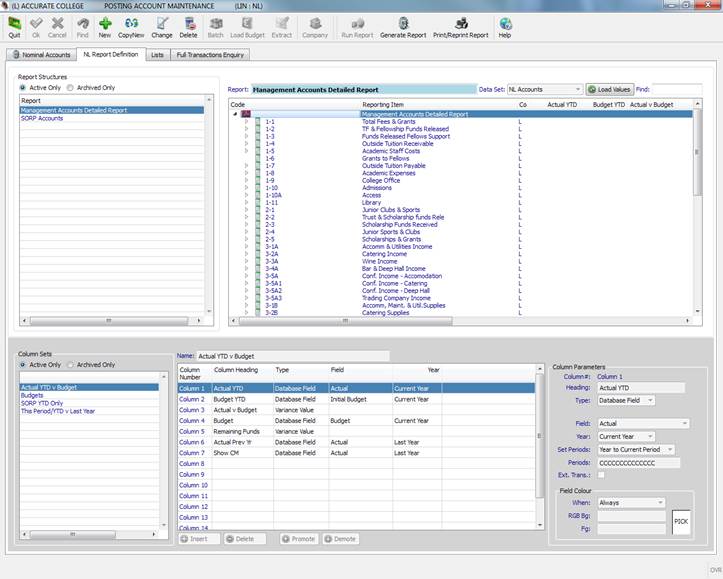
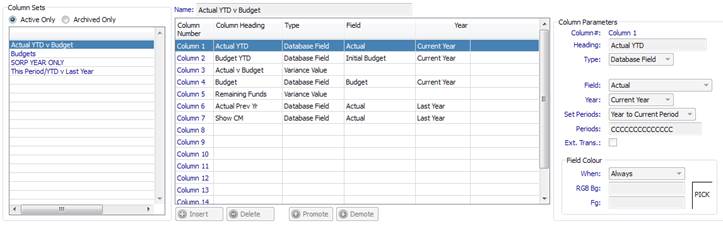
DEFINING COLUMN SETSColumn Sets are used to define which data fields (including variance fields) appear on an outputted report. Any Column Set can be combined with any Report Structure to produce a report. You may define up to 15 columns in a column set, although reports with 9 or more columns can only be output as an Excel spreadsheet. Create Column SetTo create a Column Set, first click into the Column Set
navigation grid, and click the New Enter the details as documented in Setting
Column Set Details. Change Column SetTo modify a Column Set, highlight the required Column Set
in the navigation grid and click the Change Enter the details as documented in Setting Column Set Details. Copy Column SetTo copy a Column Set to a new set highlight the required
Column Set in the navigation grid and click the CopyNew Enter the details as documented in Setting Column Set Details. Delete (Archive) Column SetDeleting a Column Set actually archives it, removing it from the ‘Active’ list and moving it to the ‘Archived’ list. To archive a Column Set, highlight the required Column Set
in the navigation grid and click the Delete You will be asked to confirm archiving, simply click Yes to continue.
|
Figure 2: Top Toolbar for New, Copy New, Change and Delete
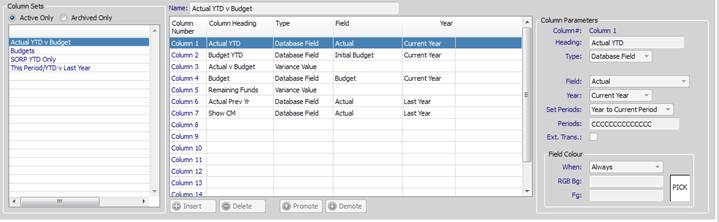
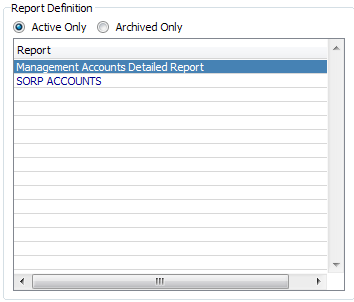
Figure 3: Column Sets can be run against any report structure. Notice how the background is white when Column Sets is active rather than Report Structures.
Figure 4: Greyed out means you are working on Report Structures. Clicking New, CopyNew, Change or Delete will be applied to Report Structure and NOT Column Sets. Click into the right hand navigation grid for Column Sets to activate Column sets. |
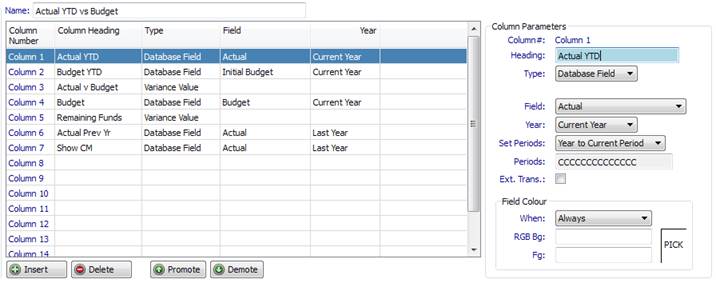
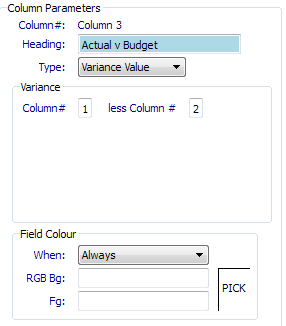
SETTING COLUMN SET DETAILSBefore you can enter details for the column data you must enter the Column Set name. This must be unique and will highlight in pink if a duplicate exists. For each column in the set, you should provide a Heading for that column, then define the field. Fields may be either a database field, or a variance between other columns (value or percentage). Database Field Parameters:· Field: Originating database field: Actual, Initial Budget, Revised Budget or Operating Budget · Year: Select the year, relative to the year specified at run time (with ‘Current Year’ representing the year specified at run time) · Set Periods: These are a set of default period values, such as current period, last quarter, year to date etc in template form to populate the Periods field. · Periods: Period markers to indicate which period(s) (relative to run
period) to use for data values. The first character indicates current month,
second character last month etc. ‘Y’ means include, ‘N’ means exclude whilst
all ‘C’s represent Year to current period: Phil,
Please correct this. Jeff · Ext. Trans: Extract
Transactions, Yes or No? When? How? · Field Colour: Individual columns can be set to a specified background and foreground colour. Specify when (Always or negative (-ve) values only), then either type in the Bg (background: default white) and Fg (foreground: default black) colours or click ‘Pick’ to open the colour picker. Variance Field Parameters:· Type: Variance Value or Variance Percentage · Column # The column number of the data field you subtract the second column from to calculate variance. · Less Column # The column number of the data field to subtract from the first column to calculate variance. · Field Colour: As above. You
can insert columns between other columns using the Click the OK
|
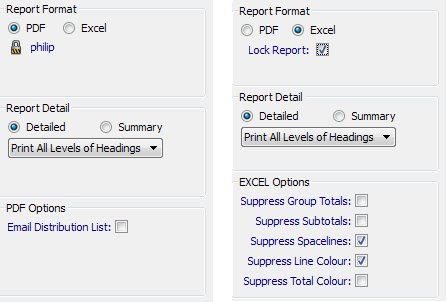
Figure 5: Enter up to 8 columns for PDF or Excel reports, and up to 15 columns for Excel only reports
Figure 6: Enter details of data fields
Figure 7: Enter details of variance fields
Figure 8: Insert or Delete Columns. Move columns up and down in the sequence |
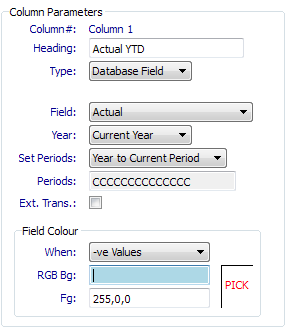
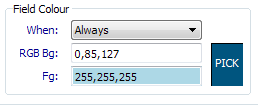 Field
colour can be always on, or only when the data values is negative. You can
set a background colour, foreground (text) colour or both.
Field
colour can be always on, or only when the data values is negative. You can
set a background colour, foreground (text) colour or both.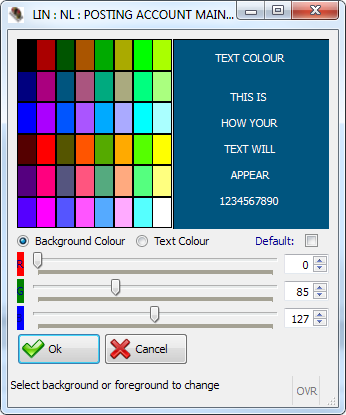
DEFINING REPORT STRUCTUREThe report structure is used to layout the Nominal Ledger accounts in a
meaningful manner for financial and management reporting. To achieve this, you are able to create up to 5 layers of headers and
sub headers and produce reports against NL Accounts or SORP and Management
Accounts (expanded to individual NL accounts during output). If you have a multi-company NL, you are able to create consolidated
reporting by including accounts from more than one NL company. To further help with structure, you are able to insert Page Breaks
sub-totals and blank lines at any point. The report structure is defined using a ‘tree-view’ of the data. This
allows you to expand and collapse branches of the tree (headings) which
allows you to better follow the report structure. Create Report StructureTo create a Report Structure first click into the Report
Definition navigation grid, and click the New Enter the details as documented in Setting Report Structure Change Report StructureTo modify a Report Structure, click the required Report
Structure in the navigation grid and click the Change Enter the details as documented in Setting Report Structure Copy Report StructureTo copy a Report Structure to a new one, click the CopyNew
Enter the details as documented in Setting Report Structure Delete (Archive) Report StructureDeleting a Report Structure actually archives it, moving it from the ‘Active’ list to the ‘Archived’ list. To archive a Report Structure, click the required Report
Structure in the navigation grid and click the Delete You will be asked to confirm archiving, simply click Yes to continue.
|
Figure 10: Top Toolbar for New, Copy New, Change and Delete
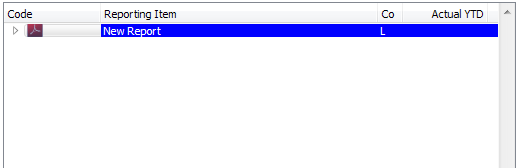
Figure 11: Navigation grid shows existing reports.
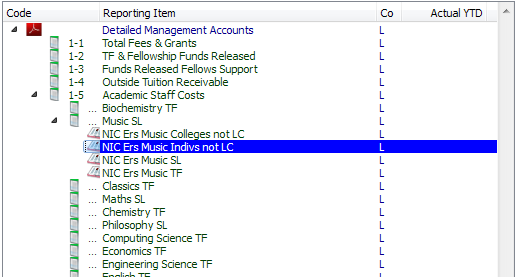
Figure 12: The report structure is defined using a Tree View. You expand or collapse individual branches for ease of viewing |
SETTING REPORT STRUCTURE
Before you can enter details for the column data you must enter the Report name. This must be unique and will highlight in pink if a duplicate exists within the same NL company you are connected to. You will then need to define the data set being used. The choices here
are: 1. NL Accounts Inidividual NL Posting Accounts. 2. SORP Accounts SORP accounts. These will be expanded to show the individual NL Posting
Accounts at print time, grouped by SORP Account. 3. Management Account Management Accounts. These will be expanded to show the individual NL
Posting Accounts at print time, grouped by Management Account. You may also specify an Audience. This will be the standard distribution
list for this report. For version 1.0
‘Distribute Report’ will not be working, but you can set up the audience for
use in future versions. Once these details have been entered you are able to begin defining the report structure.
|
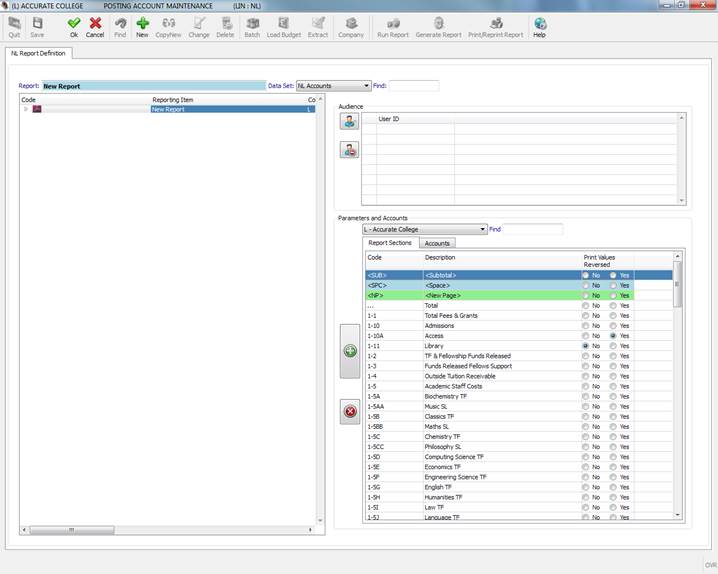
Figure
13: The NL Report Structure.
Left hand pane holds the report structure. Top right hand pane the audience.
Bottom right hand pane holds the Report Sections
and the accounts to be placed into the structure. |
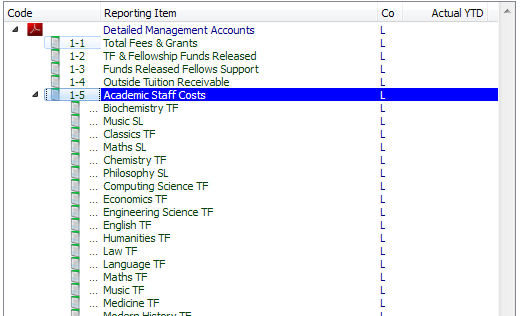
Defining the Report StructureThe screen in split into 2 main sections for defining the report structure. On the left is the report structure, in tree-view, showing the structure as it is built. All reports hang from the ‘root’ node. On the right is the available components, within the ‘Parameters and Accounts’ section. This contains two pages: Page one is ‘Report Sections’. This contains the
report sections – headers, and the special lines – sub totals, blank lines
(space) and page breaks (new page). Page Two is ‘Accounts’ - the report lines and will contain either: NL
Posting Accounts, SORP Accounts or Management Accounts depending upon the
dataset specified. To build a report structure you need to combine the report sections
with the accounts within the report structure tree on the left. Accounts must
be placed within report headers/sub-headers and should not be placed within
the ‘root’ node. A useful way to start a report is to create
your top level headings first and then expand each one to create the next
level of headings (where required). Once the heading structure is in place
(either for one section or the whole report) you can begin placing accounts under the headings.
|
Figure 14: The 'Report Structure' tree view. Empty except the 'root' node
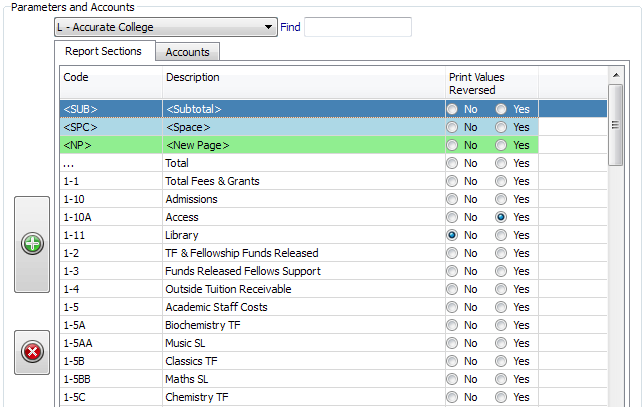
Figure 15: ‘Report Sections’ contains the headers, and special lines (sub totals, space lines and new page |
Placing Headers into a ReportThere are two ways of placing elements from the right hand side
(headings, specials or accounts) into the report structure: Drag and Drop or
highlight and click. To drag and drop items:1.
Select
the header item(s) in the NL Parameters list. a.
To
select a range left-click the highest item to add, then hold Shift whilst
left-clicking the lower item. b.
To
select items not all together left-click the first item you want and then
pressing and holding Ctrl key, left-click all additional items. c.
To
select a single item, simply left-click on that one item. 2.
Release
the mouse button, then click on one of the highlighted items and ‘hold’ (do
not release) the mouse button. Whilst still holding down the mouse left-click
button, drag the items over to the report structure tree. Still holding the
button, highlight the ‘root’ node to create top level headers,
or to create sub headings highlight the header that will become the parent of
these items. Release the left mouse button to drop. When dropping
items, there are visual clues to show if the item will be inserted as a
sibling, a child or appended as a child. See Dropping Dragged Items for a detailed
explanation. To use highlight and click:1.
Select
the header item(s) in the NL Parameters list. a.
To
select a range left-click the highest item to add, then hold Shift whilst
left-clicking the lower item b.
To
select items not all together left-click the first item you want and then
pressing and holding Ctrl key, left-click all additional items c.
To
select a single item, simply left-click on that one item. 2.
Release
the mouse button. Now left-click the ‘root’ node to create top level headers,
or to create sub headings left-click the parent header. Now click the Continue to do this until you are happy with the report structure, or
until you wish to start fleshing out
sections with accounts. To remove heading, special items or accounts see Removing Elements from a Report Structure. To move headings, special items or accounts within a report structure,
see Moving Elements in a Report Structure. If you require new headers or want to change existing ones, see Managing Headers. To save your work at any point, click the
Save
|
Figure 16: Holding Ctrl whilst clicking allows several items to be selected. Holding Shift whilst clicking selects a range
Figure 17: Add headers and sub headers to create your report structure.
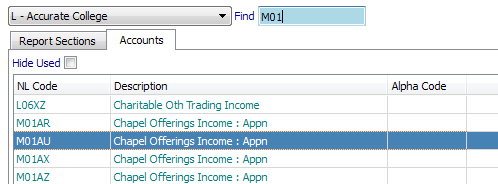
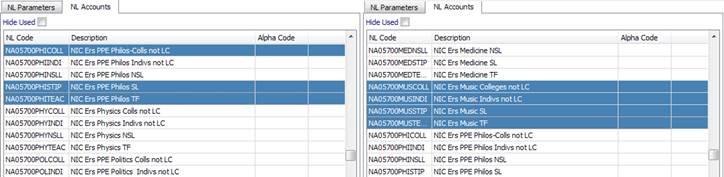
Figure 18: Hint: You can quickly find an account by typing into the 'Find' box above the accounts
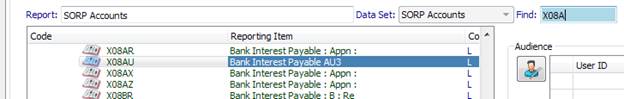
Figure 19: Hint: You can quickly find an element in the report structure by typing into the Find box next to the data set |
Placing Accounts into a ReportThere are three ways of placing accounts
from the right hand side into the report structure: Drag and Drop, button
clicks or double-clicking the account. To drag and drop items:1.
Select
the header item(s) in the Accounts list a.
To
select a range left-click the highest item to add, then hold Shift whilst
left-clicking the lower item. b.
To
select items not all together left-click the first item you want and then
pressing and holding Ctrl key, left-click all additional items. c.
To
select a single item, simply left-click on that one item. 2.
Release
the mouse button, then click on one of the highlighted items and ‘hold’ (do
not release) the mouse button. Whilst still holding down the mouse left-click
button, drag the items over to the report structure tree. Still holding the
button, highlight the parent header of these items. Release the left mouse
button to drop. When dropping
items, there are visual clues to show if the item will be inserted as a
sibling, a child or appended as a child. See Dropping Dragged Items for a detailed
explanation. To use buttons:1.
Select
the header item(s) in the NL Parameters list. a.
To
select a range left-click the highest item to add, then hold Shift whilst
left-clicking the lower item b.
To
select items not all together left-click the first item you want and then
pressing and holding Ctrl key, left-click all additional items c.
To
select a single item left-click on that one item. 2.
Release
the mouse button. Now left-click the highlight the parent header of these
items. Now click the To double-click:1. In the report structure click and highlight the parent header to append account to, or click the ‘sibling’ account to insert beneath. 2. Double-click (two quick left clicks) the account to add. Continue to do this until you are happy
with the report structure. To remove heading, special items or
accounts see Removing Elements from a
Report Structure. To move headings, special items or
accounts within a report structure, see Moving
Elements in a Report Structure. To save your work at any point, click the
Save
|
Figure 20: Holding Ctrl whilst clicking allows several items to be selected. Holding Shift whilst clicking selects a range
Figure 21: Build up your report into sections, then drop in accounts
Figure 22: Hint: You can quickly find an account by typing into the 'Find' box above the accounts
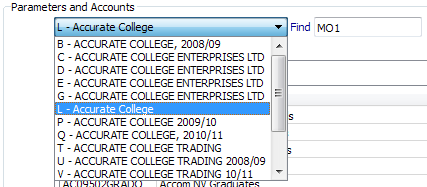
Figure 23: Hint: You can quickly find an element in the report structure by typing into the Find box next to the data set
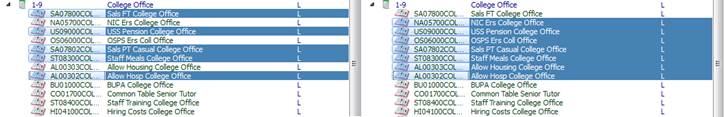
Figure 24: You can place accounts from multiple colleges into your reports for consolidated management reporting |
Removing Elements from a Report StructureAs you build up your report you will invariably place things accidently within the report structure, or in the wrong place, or simply change your mind. These items, if in the wrong place, can be moved or removed entirely. To remove them: 1.
Select
the items to remove in the tree structure a.
To
select a range left-click the highest item to add, then hold Shift whilst
left-clicking the lower item b.
To
select items not all together left-click the first item you want and then pressing
and holding Ctrl key, left-click all additional items c.
To
select a single item, simply left-click on that one item. 2.
To
remove the items, click the Delete To save your work at any point, click the
Save |
Figure
25: Holding Ctrl whilst
clicking allows several items to be selected. Holding Shift whilst clicking
selects a range |
Moving Elements in a Report StructureAs you build up your report you will invariably place things in the wrong place, or simply change your mind about where they sit in the report.. These items can be moved using drag and drop or removed entirely. To move them: 1.
Select
the items to move in the tree structure a.
To
select a range left-click the highest item to add, then hold Shift whilst
left-clicking the lower item b.
To
select items not all together left-click the first item you want and then
pressing and holding Ctrl key, left-click all additional items c.
To
select a single item, simply left-click on that one item. 2.
Left-click
one of the highlighted items and continue to hold down the left mouse button
without releasing. 3.
Move
the mouse and you will see the whole selection moving with you. If you wish
to cancel the move press the Esc(ape) key on the
keyboard. 4.
Move
the selection to where you wish to drop it and release the left mouse button.
The selection will now be inserted at the point you selected, or as a child
of the heading highlighted. When dropping
items, there are visual clues to show if the item will be inserted as a
sibling, a child or appended as a child. See Dropping Dragged Items for a detailed
explanation. To save your work at any point, click the
Save
|
Figure 26: Holding Ctrl whilst clicking allows several items to be selected. Holding Shift whilst clicking selects a range |

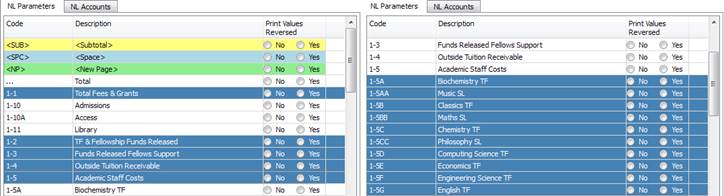
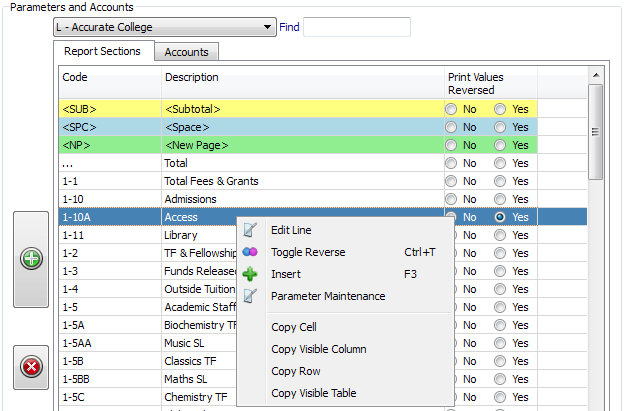
Managing HeadersReports are structured around user defined headings. Headings can be nested within each other to create sub-headings, and can be used multiple times within a report structure (eg, Income and Expense headings under multiple department headers), Defined headers are shown when editing a report structure (see Managing Report Structure) in the bottom right hand pane. By right clicking an item in the ‘Report Sections’ table you have the ability to amend entries. The available options are: 1. Edit Line Change the header text and the ‘Print Values Reversed’ for the highlighted header. 2. Toggle Reverse Toggle the ‘Print Values Reversed’ attribute on/off. If set to ‘Yes’ then negative values will print positive and positive values will print negative. Totals will always use the original value to prevent report and parent group totals becoming misleading. If no previous attribute has been set it will be functioning as if ‘No’ had been selected although toggling it will initially set it to No. 3. Insert Insert will allow you to enter a code, description and negative value parameter for a new header. The code must be unique. 4. Parameter Maintenance ‘Report Sections’ are stored in the NL Parameter file, with a type of NLH and can be maintained in Parameter Maintenance. Clicking this option will open Parameter Maintenance for header section. The ‘Print Values Reversed’ parameter is a ‘Y’ or ‘N’ held in the ‘Extra Info’ field. |
Figure 27: Bottom right hand pane when editing a report structure holds the report sections. Right clicking an item brings up the edit menu.
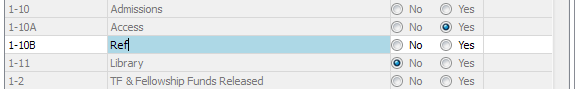
Figure 28: Inserting or changing a header is done in place in the table. Click OK to accept, or Cancel to abandon the change. |
Dropping Dragged ItemsWhen highlighting
an area to drop to, there are visual clues that appear at the target location
to identify what will happen if you drop. 1.
If
the target heading is completely bordered by a thick blue box, the dropped
items will become children of the highlighted heading and will be appended to
the end of any existing items. 2.
If a
single, thick blue horizontal line appears between 2 items, the dropped items
will be inserted between them as a ‘siblings’, appearing at the same level. 3.
If
you are highlighting the first item within a heading and a thick horizontal
line appears above that item, and a thick blue box around only the ‘code’
element of the heading above, you will be dropping this as the new first
element of that heading. 4.
If
you are dragging accounts, space lines, sub totals or page breaks to insert
between accounts, these will always be placed as siblings regardless of what
type of visual clue is showing.
|
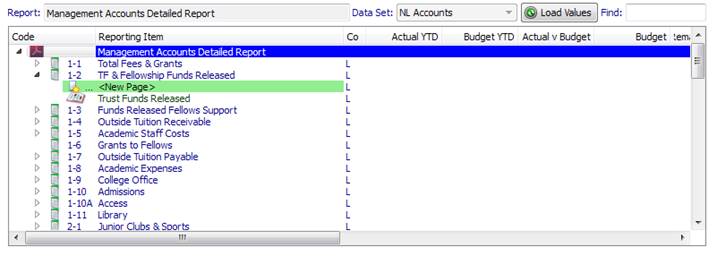
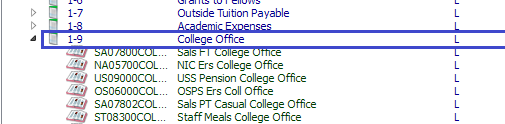
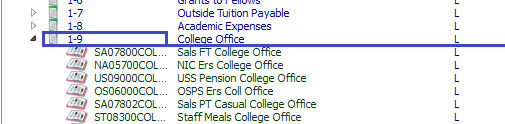
Figure 29: Thick blue box around all fields (code, description etc): item will be appended as a child of '1-9 College Office’, being placed after all existing children.
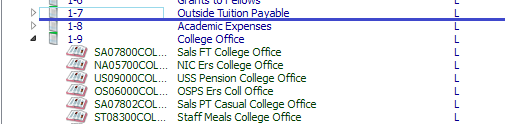
Figure 30: Thick blue line: Item will be inserted between ‘1-7 Outside Tuition Payable’ and ‘1-8 Academic Expenses’ as a sibling.
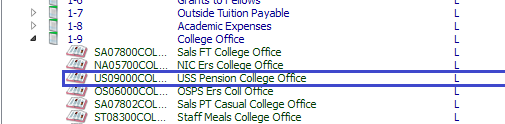
Figure 31: Thick blue horizontal line with box around heading code only: Item will be inserted as first child within ‘1-9 College Office’
Figure
32: Unimportant what visual clue is displayed as accounts cannot
have children so items will be dropped as siblings. |
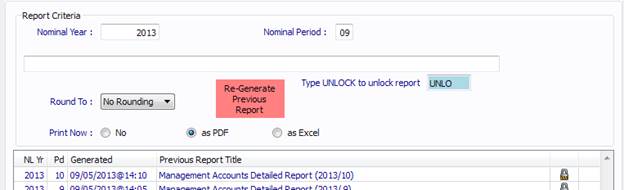
GENERATING REPORT DATABefore a report can be printed, the data for the report must be compiled. Compiling the report data separately from printing the report allows us a few benefits: 1. The hard part is done just once, no matter how many times we reprint or what format we output it in. 2. We can produce the figures and then adjust them before printing. 3. We can lock a set report to prevent adjustments to the column sets/report structure or further adjustments from taking effect. When generating a report, you must select a Report Structure and a Column Set to use. A report data set will then be created for this combination. To Generate a report: 1. Select the active Report Structure you wish to use. 2. Select the active Column Set you wish to use. 3. Click ‘Generate Report’ from the top toolbar. 4. In the popup window, enter the ‘Nominal Year’ and ‘Nominal Period’ that will represent ‘Current Period’ within the report, or double click an existing report data set (point 6). 5.
Enter a ‘Report Title’. This will be defaulted
for you when you click into the title field. If you click the OK 6. To regenerate an existing report (because of adjustments or changes to the report structure/column set), double click a previously generated report data set (or right click and choose Regenerate) to load Nominal Year, Nominal Period and report title. 7. If regenerating a report where the data set has been locked, the user who locked it must unlock it: a. With the user who locked the system logged in, choose ‘Generate Report’ within NL Report Definition. b. Double-click (or right-click and choose Regenerate) the required report data set to populate the details. c. Enter UNLOCK in the unlock field d. The report will be unlocked immediately. e.
The user may then either continue to
regenerate the report data set, or choose Cancel 8. Select how you want it printed (or select No to stop it printing). 9.
Click the OK
|
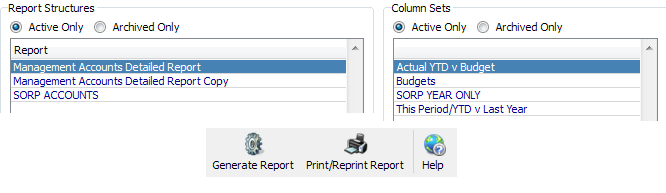
Figure 33: Select your Report Structure and Column Set to generate report for
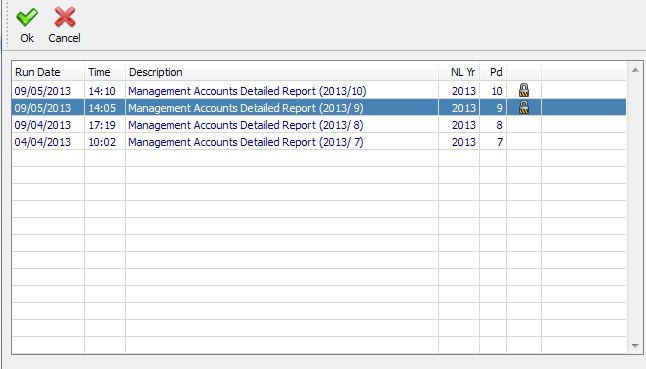
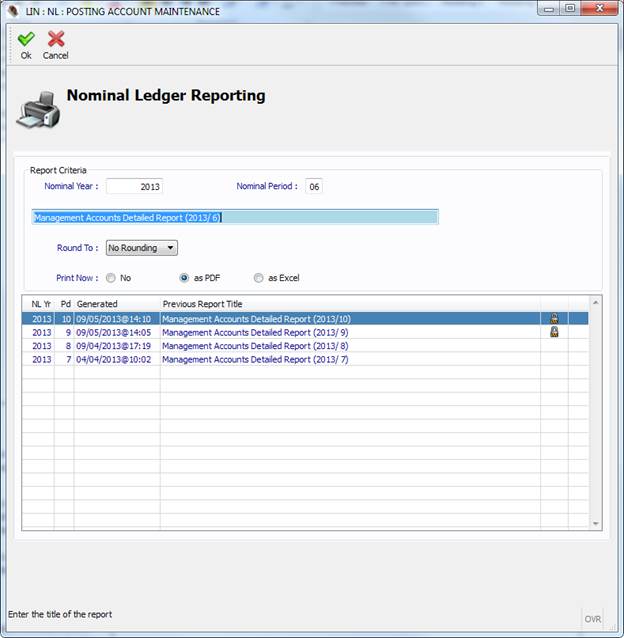
Figure 34: You must enter a Nominal Year, Period and Report Title before a report data set can be generated. Previous generations of the report data are shown in a table below the entry fields.
Figure 35: Previously generated data sets might have been locked at print-time. If you were the one who locked it you can unlock it by typing UNLOCK in the unlock box. If someone else locked it you need to get them to unlock it. |
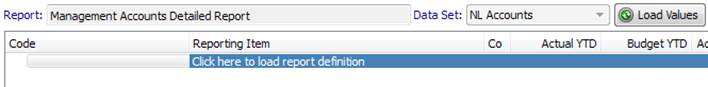
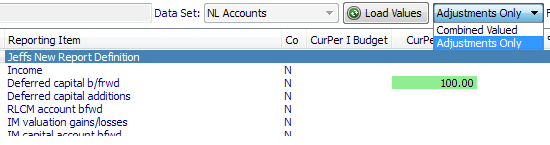
ADJUSTING REPORT VALUESOnce a report data set has been generated it is possible to make adjustments to reflect any known changes, such as unposted items, for an accurate management report to be produced. Once adjustments have been made, the report will need to be regenerated before it can be printed to reflect the adjustments. Between adding a new adjustment and regenerating the report data set, adjustments can be deleted. Once an adjustment has been included in a generated report data set it can no longer be deleted, although it can be reversed leaving an audit trail of the original adjustment and the reversal. Before adjustments can be made you need to load values from a previously generated report data set. 1. Select the active Report Structure you wish to use. 2. Select the active Column Set you wish to use. 3.
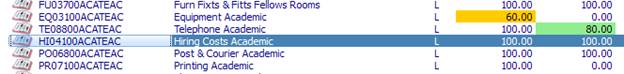
Click Once you have loaded a report data set you can: · Delete an existing adjustment · Reverse an existing adjustment Once adjustments have been made, adjusted figures can be seen by a colour code applied to the value field within the tree view of the report structure when values are loaded: ·
Amber
Value An amber value indicates that since the report was last generated an adjustment has been made. These adjustments can still be deleted if no longer required. ·
Green
Value A green value indicates that all adjustments were made prior to when the report was last generated. To undo you must reverse the adjustment.
|
Figure 36: Click 'Load Values' to load a previously generated data set. You do not need to load the report definition first
Figure 37: Select the generated report data set to load values for
Figure 38: Amber signifies a column adjusted since the last report generation and can be deleted. Green signifies the adjustment was made prior to the last report generation and must be reversed if no longer required.
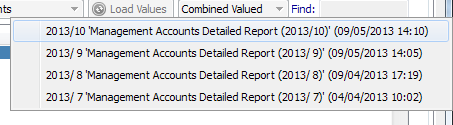
Figure
39: You can view 'Combined
Values' (original plus adjustments) or 'Adjustments Only' to show only the sum
of adjustments made to each field (without
original value) and blanks for any unadjusted fields |
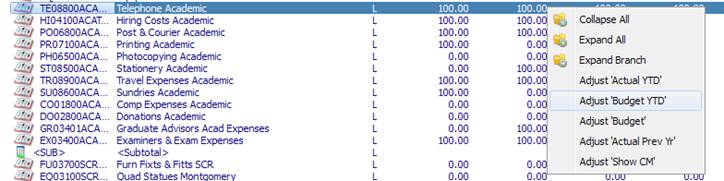
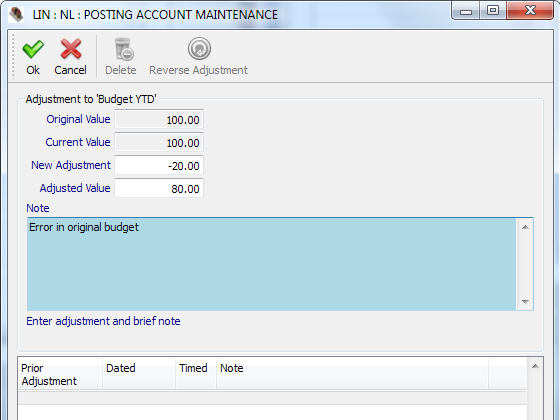
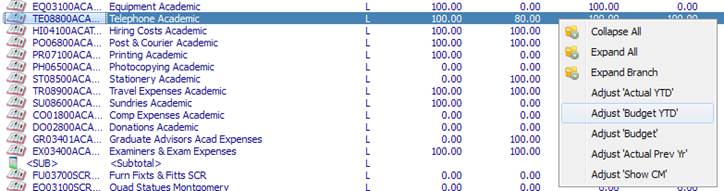
Add a New AdjustmentTo adjust a figure in a generated report data set: 1. Find the line you wish to adjust, right-click it and select the column you wish to adjust from the popup menu. 2. In the popup window that opens enter either the adjustment amount, or the adjusted value and the reason for the adjustment. 3.
Click OK
|
Figure 40: Highlight the line to adjust, right click then select the column to adjust
Figure 41: Enter the adjustment (or new value) and reason for the adjustment |
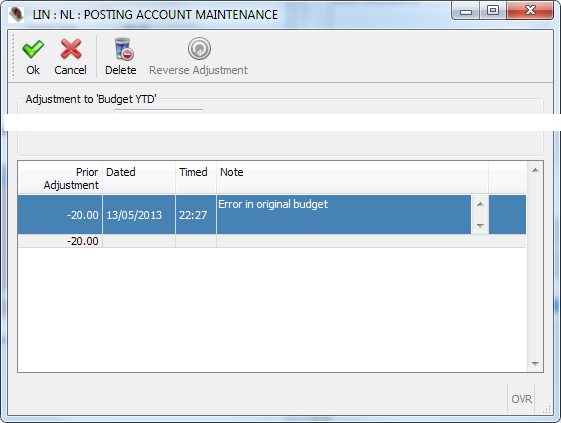
Delete an Existing AdjustmentOnly adjustments that have been made since the last report data set was generated can be deleted. Once a value has been included in a generated report data set it must be reversed so that a trail is left. To delete an adjustment: 1. Find the line you wish to delete the adjustment for, right-click it and select the column you wish to change from the popup menu. 2. In the popup window that opens select the adjustment you want to delete in the Prior Adjustment table. 3.
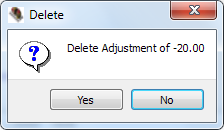
Click the Delete 4. Confirm the deletion in the popup confirmation box
|
Figure 42: Select the adjusted line, right click it and select the adjusted column
Figure 43: Select the adjustment from the Prior Adjustment table then click Delete
Figure 44: Confirm deletion of the adjustment |
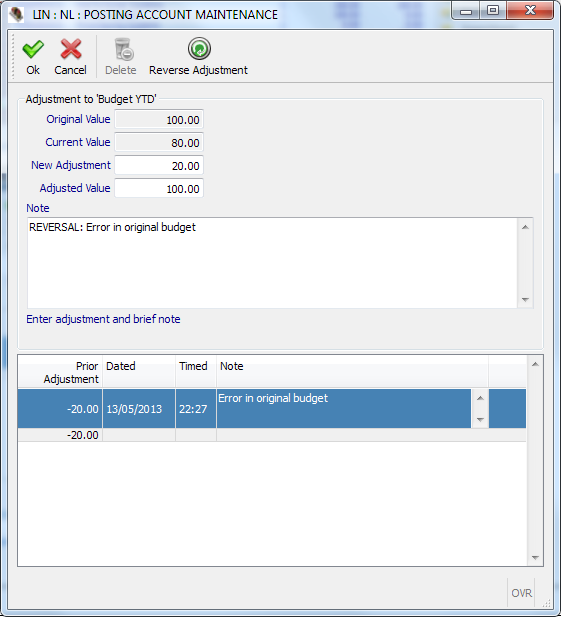
Reverse an Existing AdjustmentOnly adjustments that have been made since the last report data set was generated can be deleted. Once a value has been included in a generated report data set it must be reversed so that a trail is left. To reverse an adjustment: 1. Find the line you wish to reverse the adjustment for, right-click it and select the column you wish to change from the popup menu. 2. In the popup window that opens select the adjustment you want to reverse in the Prior Adjustment table. 3.
Click Reverse Adjustment 4. This will populate a new adjustment, the reverse of the original. 5.
Click OK |
Figure 45: Select the adjusted line, right click it and select the adjusted column
Figure 46: Select the adjustment from the Prior Adjustment table then click Reverse Adjustment. This will populate a new adjustment to reverse the original without deleting it. |